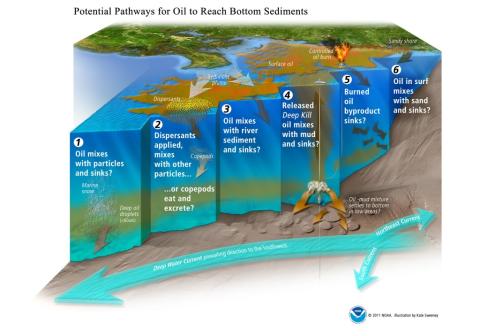
After the Deepwater Horizon spill, oil moved through the water column in a variety of ways. We knew there were several possible scenarios for how it might move into the sediments at the bottom of the ocean. NOAA communicators faced a challenge to clearly describe the different ways oil could move into the sediment layer at the ocean floor.
Using mapping data and discussing the concepts with NOAA scientists, medical and scientific illustrator Kate Sweeney developed a single, striking graphic illustration that clearly encompassed all the most likely possibilities:
Another of Kate's images was used as part of the Programmatic Environmental Impact Statement public scoping process to illustrate the Gulf ecosystem and potential oil impacts:
In a recent post on the Office of Response and Restoration's blog, Kate compared the process of creating complex scientific images to telling a story. She has seen demand for her illustrations grow as the expectation for high-quality visuals has increased. Kate said a key component to the process was working collaboratively with the scientists.
The OR&R blog features posts from scientists and staff discussing how they respond to spills of oil and other hazardous waste. They also delve into what it takes to restore the coastal and marine ecosystems and economies damaged by these spills.


